


You are looking at the documentation of a prior release. To read the documentation of the latest release, please
visit here.
New to Stash? Please start here.
Monitoring Stash
Stash has native support for monitoring via Prometheus. You can use builtin Prometheus scrapper or CoreOS Prometheus Operator to monitor Stash. This tutorial will show you how this monitoring works with Stash and how to enable them.
Overview
Stash uses Prometheus PushGateway to export the metrics for backup & recovery operations. Following diagram shows the logical structure of Stash monitoring flow.
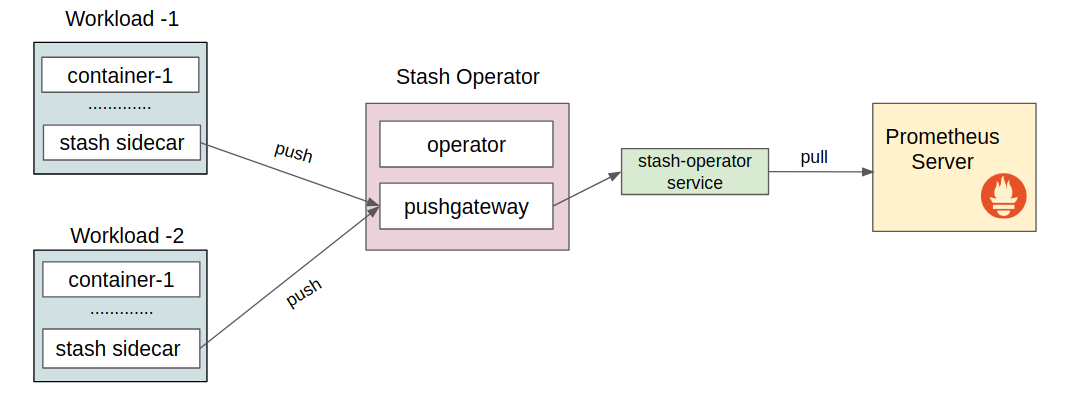
Stash operator runs two containers. The operator container runs controller and other necessary stuffs and the pushgateway container runs prom/pushgateway image. Stash sidecar from different workloads pushes their metrics to this pushgateway. Then Prometheus server scraps these metrics through stash-operator service. Stash operator itself also provides some metrics at /metrics path of :8443 port.
Backup & Recovery Metrics
Following metrics are available for stash backup and recovery operations. These metrics are accessible through pushgateway endpoint of stash-operator service.
| Metric | Uses |
|---|---|
restic_session_success | Indicates if session was successfully completed |
restic_session_fail | Indicates if session failed |
restic_session_duration_seconds_total | Seconds taken to complete restic session for all FileGroups |
restic_session_duration_seconds | Seconds taken to complete restic session for a FileGroup |
Operator Metrics
Following metrics are available for Stash operator. These metrics are accessible through api endpoint of stash-operator service.
- apiserver_audit_event_total
- apiserver_client_certificate_expiration_seconds_bucket
- apiserver_client_certificate_expiration_seconds_count
- apiserver_client_certificate_expiration_seconds_sum
- apiserver_current_inflight_requests
- apiserver_request_count
- apiserver_request_latencies_bucket
- apiserver_request_latencies_count
- apiserver_request_latencies_sum
- apiserver_request_latencies_summary
- apiserver_request_latencies_summary_count
- apiserver_request_latencies_summary_sum
- apiserver_storage_data_key_generation_failures_total
- apiserver_storage_data_key_generation_latencies_microseconds_bucket
- apiserver_storage_data_key_generation_latencies_microseconds_count
- apiserver_storage_data_key_generation_latencies_microseconds_sum
- apiserver_storage_envelope_transformation_cache_misses_total
- authenticated_user_requests
- etcd_helper_cache_entry_count
- etcd_helper_cache_hit_count
- etcd_helper_cache_miss_count
- etcd_request_cache_add_latencies_summary
- etcd_request_cache_add_latencies_summary_count
- etcd_request_cache_add_latencies_summary_sum
- etcd_request_cache_get_latencies_summary
- etcd_request_cache_get_latencies_summary_count
- etcd_request_cache_get_latencies_summary_sum
How to Enable Monitoring
You can enable monitoring through some flags while installing or upgrading or updating Stash via both script and Helm. You can also chose which monitoring agent to use for monitoring. Stash will configure respective resources accordingly. Here, are the list of available flags and their uses,
| Script Flag | Helm Values | Acceptable Values | Default | Uses |
|---|---|---|---|---|
--monitoring-agent | monitoring.agent | prometheus.io/builtin or prometheus.io/coreos-operator | none | Specify which monitoring agent to use for monitoring Stash. |
--monitoring-backup | monitoring.backup | true or false | false | Specify whether to monitor Stash backup and recovery. |
--monitoring-operator | monitoring.operator | true or false | false | Specify whether to monitor Stash operator. |
--prometheus-namespace | monitoring.prometheus.namespace | any namespace | same namespace as Stash operator | Specify the namespace where Prometheus server is running or will be deployed |
--servicemonitor-label | monitoring.serviceMonitor.labels | any label | For Helm installation, app: <generated app name> and release: <release name>. For script installation, app: stash | Specify the labels for ServiceMonitor. Prometheus crd will select ServiceMonitor using these labels. Only usable when monitoring agent is prometheus.io/coreos-operator. |
You have to provides these flags while installing or upgrading or updating Stash. Here, are examples for both script and Helm installation process are given which enable monitoring with prometheus.io/coreos-operator Prometheuse server for backup & recovery and operator metrics.
Helm:
$ helm install appscode/stash --name stash-operator --version 0.8.2 --namespace kube-system \
  --set monitoring.agent=prometheus.io/coreos-operator \
  --set monitoring.backup=true \
  --set monitoring.operator=true \
  --set monitoring.prometheus.namespace=monitoring \
  --set monitoring.serviceMonitor.labels.k8s-app=prometheus
Script:
$ curl -fsSL https://raw.githubusercontent.com/appscode/stash/0.8.2/hack/deploy/stash.sh  | bash -s -- \
  --monitoring-agent=prometheus.io/coreos-operator \
  --monitoring-backup=true \
  --monitoring-operator=true \
  --prometheus-namespace=monitoring \
  --servicemonitor-label=k8s-app=prometheus