


You are looking at the documentation of a prior release. To read the documentation of the latest release, please
visit here.
Monitoring Stash with builtin Prometheus
This tutorial will show you how to configure builtin Prometheus scraper to monitor Stash backup and restore operations as well as Stash operator.
Before You Begin
At first, you need to have a Kubernetes cluster, and the kubectl command-line tool must be configured to communicate with your cluster. If you do not already have a cluster, you can create one by using kind.
To keep Prometheus resources isolated, we are going to use a separate namespace to deploy Prometheus server.
$ kubectl create ns monitoring
namespace/monitoring created
Enable Monitoring in Stash
Enable Prometheus monitoring using prometheus.io/builtin agent while installing Stash. To know details about how to enable monitoring see here. Here, we are going to enable monitoring for backup, restore and operator metrics using Helm 3.
$ helm install stash-operator appscode/stash --version v2020.08.27 \
  --namespace kube-system \
  --set monitoring.agent=prometheus.io/builtin \
  --set monitoring.backup=true \
  --set monitoring.operator=true \
  --set monitoring.prometheus.namespace=monitoring
This will add necessary annotations to stash-operator service. Prometheus server will scrape metrics using those annotations. Let’s check which annotations are added to the service,
$ kubectl get service -n kube-system stash-operator -o yaml
apiVersion: v1
kind: Service
metadata:
  annotations:
    kubectl.kubernetes.io/last-applied-configuration: |
      {"apiVersion":"v1","kind":"Service","metadata":{"annotations":{},"labels":{"app":"stash"},"name":"stash-operator","namespace":"kube-system"},"spec":{"ports":[{"name":"api","port":443,"targetPort":8443},{"name":"pushgateway","port":56789,"targetPort":56789}],"selector":{"app":"stash"}}}
    prometheus.io/operator_path: /metrics
    prometheus.io/operator_port: "8443"
    prometheus.io/operator_scheme: https
    prometheus.io/pushgateway_path: /metrics
    prometheus.io/pushgateway_port: "56789"
    prometheus.io/pushgateway_scheme: http
    prometheus.io/scrape: "true"
  creationTimestamp: 2018-11-07T04:10:26Z
  labels:
    app: stash
  name: stash-operator
  namespace: kube-system
  resourceVersion: "1649"
  selfLink: /api/v1/namespaces/kube-system/services/stash-operator
  uid: 0e73664a-e243-11e8-a768-080027767ca3
spec:
  clusterIP: 10.105.200.228
  ports:
  - name: api
    port: 443
    protocol: TCP
    targetPort: 8443
  - name: pushgateway
    port: 56789
    protocol: TCP
    targetPort: 56789
  selector:
    app: stash
  sessionAffinity: None
  type: ClusterIP
status:
  loadBalancer: {}
Here, prometheus.io/scrape: "true" annotation indicates that Prometheus should scrape metrics for this service.
The following three annotations point to pushgateway endpoints which provides backup and restore metrics.
prometheus.io/pushgateway_path: /metrics
prometheus.io/pushgateway_port: "56789"
prometheus.io/pushgateway_scheme: http
The following three annotations point to api endpoints which provides operator specific metrics.
prometheus.io/operator_path: /metrics
prometheus.io/operator_port: "8443"
prometheus.io/operator_scheme: https
Now, we are ready to configure our Prometheus server to scrape those metrics.
Deploy Prometheus Server
We have deployed Stash in kube-system namespace. Stash exports operator metrics via TLS secured api endpoint. So, Prometheus server need to provide certificate while scraping metrics from this endpoint. Stash has created a secret named stash-apiserver-certs with this certificate in monitoring namespace as we have specified that we are going to deploy Prometheus in that namespace through --prometheus-namespace flag. We have to mount this secret in Prometheus deployment.
Let’s check stash-apiserver-cert certificate has been created in monitoring namespace.
$ kubectl get secret -n monitoring -l=app=stash
NAME                   TYPE                DATA   AGE
stash-apiserver-cert   kubernetes.io/tls   2      2m21s
Create RBAC:
If you are using a RBAC enabled cluster, you have to give necessary RBAC permissions for Prometheus. Let’s create necessary RBAC stuffs for Prometheus,
$ kubectl apply -f https://github.com/stashed/docs/raw/v2020.08.27/docs/examples/guides/latest/monitoring/builtin/prom-rbac.yaml
clusterrole.rbac.authorization.k8s.io/stash-prometheus-server created
serviceaccount/stash-prometheus-server created
clusterrolebinding.rbac.authorization.k8s.io/stash-prometheus-server created
Create ConfigMap:
Now, create a ConfigMap with necessary scraping configuration. Bellow, the YAML of ConfigMap that we are going to create in this tutorial.
apiVersion: v1
kind: ConfigMap
metadata:
  name: stash-prometheus-server-conf
  labels:
    name: stash-prometheus-server-conf
  namespace: monitoring
data:
  prometheus.yml: |-
    global:
      scrape_interval: 30s
      scrape_timeout: 10s
      evaluation_interval: 30s
    scrape_configs:
    - job_name: stash-pushgateway
      scrape_interval: 30s
      scrape_timeout: 10s
      metrics_path: /metrics
      scheme: http
      honor_labels: true
      kubernetes_sd_configs:
      - role: endpoints
      relabel_configs:
      - source_labels: [__meta_kubernetes_service_label_app]
        regex: stash # default label for stash-operator service is "app: stash". customize this field according to label of stash-operator service of your setup.
        action: keep
      - source_labels: [__meta_kubernetes_service_annotation_prometheus_io_scrape]
        regex: true
        action: keep
      - source_labels: [__meta_kubernetes_endpoint_port_name]
        regex: pushgateway
        action: keep
      - source_labels: [__meta_kubernetes_service_annotation_prometheus_io_pushgateway_path]
        regex: (.+)
        target_label: __metrics_path__
        action: replace
      - source_labels: [__meta_kubernetes_service_annotation_prometheus_io_pushgateway_scheme]
        action: replace
        target_label: __scheme__
        regex: (https?)
      - source_labels: [__address__, __meta_kubernetes_service_annotation_prometheus_io_pushgateway_port]
        action: replace
        target_label: __address__
        regex: ([^:]+)(?::\d+)?;(\d+)
        replacement: $1:$2
      - source_labels: [__meta_kubernetes_namespace]
        separator: ;
        regex: (.*)
        target_label: namespace
        replacement: $1
        action: replace
      - source_labels: [__meta_kubernetes_service_name]
        separator: ;
        regex: (.*)
        target_label: service
        replacement: $1
        action: replace
    - job_name: stash-operator
      scrape_interval: 30s
      scrape_timeout: 10s
      metrics_path: /metrics
      scheme: https
      kubernetes_sd_configs:
      - role: endpoints
      bearer_token_file: /var/run/secrets/kubernetes.io/serviceaccount/token
      tls_config:
        ca_file: /etc/prometheus/secret/stash-apiserver-cert/tls.crt
        server_name: stash-operator.kube-system.svc
      relabel_configs:
      - source_labels: [__meta_kubernetes_service_label_app]
        regex: stash # default label for stash-operator service is "app: stash". customize this field according to label of stash-operator service of your setup.
        action: keep
      - source_labels: [__meta_kubernetes_service_annotation_prometheus_io_scrape]
        regex: true
        action: keep
      - source_labels: [__meta_kubernetes_endpoint_port_name]
        regex: api
        action: keep
      - source_labels: [__meta_kubernetes_service_annotation_prometheus_io_operator_path]
        regex: (.+)
        target_label: __metrics_path__
        action: replace
      - source_labels: [__meta_kubernetes_service_annotation_prometheus_io_operator_scheme]
        action: replace
        target_label: __scheme__
        regex: (https?)
      - source_labels: [__address__, __meta_kubernetes_service_annotation_prometheus_io_operator_port]
        action: replace
        target_label: __address__
        regex: ([^:]+)(?::\d+)?;(\d+)
        replacement: $1:$2
      - source_labels: [__meta_kubernetes_namespace]
        separator: ;
        regex: (.*)
        target_label: namespace
        replacement: $1
        action: replace
      - source_labels: [__meta_kubernetes_service_name]
        separator: ;
        regex: (.*)
        target_label: service
        replacement: $1
        action: replace
Here, we have two scraping job. One is stash-pushgateway that scrapes backup and restore metrics and another is stash-operator which scrapes operator metrics.
Look at the tls_config field of stash-operator job. We have provided certificate file through ca_file field. This certificate comes from stash-apiserver-cert that we are going to mount in Prometheus deployment. Here, server_name is used to verify hostname. In our case, the certificate is valid for hostname server and stash-operator.kube-system.svc.
Also note that, we have provided a bearer-token file through bearer_token_file field. This file is token for stash-prometheus-server serviceaccount that we have created while creating RBAC stuffs. This is required for authorizing Prometheus to Stash API Server.
Let’s create the ConfigMap we have shown above,
$ kubectl apply -f https://github.com/stashed/docs/raw/v2020.08.27/docs/examples/guides/latest/monitoring/builtin/prom-config.yaml
configmap/stash-prometheus-server-conf created
Deploy Prometheus:
Now, we are ready to deploy Prometheus server. YAML for the deployment that we are going to create for Prometheus is shown below.
apiVersion: apps/v1
kind: Deployment
metadata:
  name: stash-prometheus-server
  namespace: monitoring
spec:
  replicas: 1
  selector:
    matchLabels:
      app: prometheus
  template:
    metadata:
      labels:
        app: prometheus
    spec:
      serviceAccountName: stash-prometheus-server
      containers:
      - name: prometheus
        image: prom/prometheus:v2.4.3
        args:
        - "--config.file=/etc/prometheus/prometheus.yml"
        - "--storage.tsdb.path=/prometheus/"
        ports:
        - containerPort: 9090
        volumeMounts:
        - name: prometheus-config-volume
          mountPath: /etc/prometheus/
        - name: prometheus-storage-volume
          mountPath: /prometheus/
        - name: stash-apiserver-cert
          mountPath: /etc/prometheus/secret/stash-apiserver-cert
      volumes:
      - name: prometheus-config-volume
        configMap:
          defaultMode: 420
          name: stash-prometheus-server-conf
      - name: prometheus-storage-volume
        emptyDir: {}
      - name: stash-apiserver-cert
        secret:
          defaultMode: 420
          secretName: stash-apiserver-cert
          items: # avoid mounting private key
          - key: tls.crt
            path: tls.crt
Notice that, we have mounted stash-apiserver-cert secret as a volume at /etc/prometheus/secret/stash-apiserver-cert directory.
Now, let’s create the deployment,
$ kubectl apply -f https://github.com/stashed/docs/raw/v2020.08.27/docs/examples/guides/latest/monitoring/builtin/prom-deployment.yaml
deployment.apps/stash-prometheus-server created
Verify Monitoring Metrics
Prometheus server is running on port 9090. We are going to use port forwarding to access Prometheus dashboard. Run following command on a separate terminal,
$ kubectl port-forward -n monitoring stash-prometheus-server-9ddbf79b6-8l6hk 9090
Forwarding from 127.0.0.1:9090 -> 9090
Forwarding from [::1]:9090 -> 9090
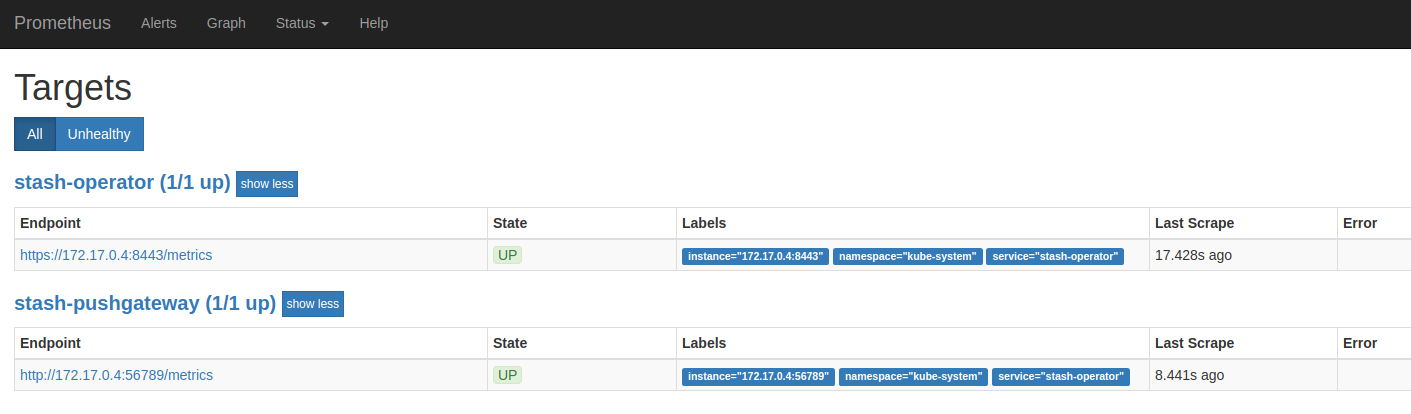
Now, we can access the dashboard at localhost:9090. Open http://localhost:9090 in your browser. You should see pushgateway and api endpoints of stash-operator service as targets.
Backup and Restore Metrics:
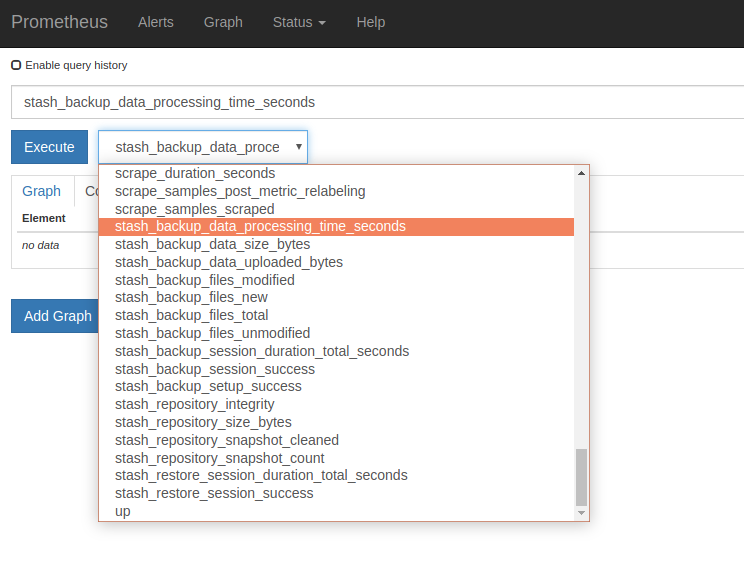
When you perform a backup or restore using Stash, it will send respective Prometheus metrics. You can check if the metrics have been sent successfully by performing backup and restore as described here.
A screenshot that shows Prometheus metrics send by Stash backup and restore process is given below,
Cleanup
To cleanup the Kubernetes resources created by this tutorial, run:
kubectl delete clusterrole stash-prometheus-server
kubectl delete clusterrolebinding stash-prometheus-server

kubectl delete serviceaccount/stash-prometheus-server -n monitoring
kubectl delete configmap/stash-prometheus-server-conf -n monitoring
kubectl delete deployment stash-prometheus-server -n monitoring
kubectl delete secret stash-apiserver-cert -n monitoring

kubectl delete ns monitoring
To uninstall Stash follow this guide.