


You are looking at the documentation of a prior release. To read the documentation of the latest release, please
visit here.
Monitoring Using Prometheus Operator
Prometheus Operator provides a simple and Kubernetes native way to deploy and configure a Prometheus server. This tutorial will show you how to use the Prometheus operator for monitoring Stash.
To keep Prometheus resources isolated, we are going to use a separate namespace monitoring to deploy the Prometheus operator and respective resources. Create the namespace if you haven’t created it yet,
$ kubectl create ns monitoring
namespace/monitoring created
Install Prometheus Stack
At first, you have to install Prometheus operator in your cluster. In this section, we are going to install Prometheus operator from prometheus-community/kube-prometheus-stack. You can skip this section if you already have Prometheus operator running.
Install prometheus-community/kube-prometheus-stack chart as below,
- Add necessary helm repositories.
helm repo add prometheus-community https://prometheus-community.github.io/helm-charts
helm repo add stable https://charts.helm.sh/stable
helm repo update
- Install
kube-prometheus-stackchart.
helm install prometheus-stack prometheus-community/kube-prometheus-stack -n monitoring
This chart will install prometheus-operator/prometheus-operator, kubernetes/kube-state-metrics, prometheus/node_exporter, and grafana/grafana etc.
The above chart will also deploy a Prometheus server. Verify that the Prometheus server has been deployed by the following command:
$ kubectl get prometheus -n monitoring
NAME                                    VERSION   REPLICAS   AGE
prometheus-stack-kube-prom-prometheus   v2.22.1   1          3m
Let’s check the YAML of the above Prometheus object,
$ kubectl get prometheus -n monitoring prometheus-stack-kube-prom-prometheus -o yaml
apiVersion: monitoring.coreos.com/v1
kind: Prometheus
metadata:
  annotations:
    meta.helm.sh/release-name: prometheus-stack
    meta.helm.sh/release-namespace: monitoring
  labels:
    app: kube-prometheus-stack-prometheus
    app.kubernetes.io/managed-by: Helm
    chart: kube-prometheus-stack-12.8.0
    heritage: Helm
    release: prometheus-stack
  name: prometheus-stack-kube-prom-prometheus
  namespace: monitoring
spec:
  alerting:
    alertmanagers:
    - apiVersion: v2
      name: prometheus-stack-kube-prom-alertmanager
      namespace: monitoring
      pathPrefix: /
      port: web
  enableAdminAPI: false
  externalUrl: http://prometheus-stack-kube-prom-prometheus.monitoring:9090
  image: quay.io/prometheus/prometheus:v2.22.1
  listenLocal: false
  logFormat: logfmt
  logLevel: info
  paused: false
  podMonitorNamespaceSelector: {}
  podMonitorSelector:
    matchLabels:
      release: prometheus-stack
  portName: web
  probeNamespaceSelector: {}
  probeSelector:
    matchLabels:
      release: prometheus-stack
  replicas: 1
  retention: 10d
  routePrefix: /
  ruleNamespaceSelector: {}
  ruleSelector:
    matchLabels:
      app: kube-prometheus-stack
      release: prometheus-stack
  securityContext:
    fsGroup: 2000
    runAsGroup: 2000
    runAsNonRoot: true
    runAsUser: 1000
  serviceAccountName: prometheus-stack-kube-prom-prometheus
  serviceMonitorNamespaceSelector: {}
  serviceMonitorSelector:
    matchLabels:
      release: prometheus-stack
  version: v2.22.1
Notice the following ServiceMonitor related sections,
serviceMonitorNamespaceSelector: {} # select from all namespaces
serviceMonitorSelector:
  matchLabels:
    release: prometheus-stack
Here, you can see the Prometheus server is selecting the ServiceMonitors from all namespaces that have release: prometheus-stack label.
The above chart will also create a Service for the Prometheus server so that we can access the Prometheus Web UI. Let’s verify the Service has been created,
$ kubectl get service -n monitoring
NAME                                        TYPE        CLUSTER-IP       EXTERNAL-IP   PORT(S)                      AGE
alertmanager-operated                       ClusterIP   None             <none>        9093/TCP,9094/TCP,9094/UDP   10m
prometheus-operated                         ClusterIP   None             <none>        9090/TCP                     10m
prometheus-stack-grafana                    ClusterIP   10.105.244.221   <none>        80/TCP                       11m
prometheus-stack-kube-prom-alertmanager     ClusterIP   10.97.172.208    <none>        9093/TCP                     11m
prometheus-stack-kube-prom-operator         ClusterIP   10.97.94.139     <none>        443/TCP                      11m
prometheus-stack-kube-prom-prometheus       ClusterIP   10.105.123.218   <none>        9090/TCP                     11m
prometheus-stack-kube-state-metrics         ClusterIP   10.96.52.8       <none>        8080/TCP                     11m
prometheus-stack-prometheus-node-exporter   ClusterIP   10.107.204.248   <none>        9100/TCP                     11m
Here, we can use the prometheus-stack-kube-prom-prometheus Service to access the Web UI of our Prometheus Server.
Enable Monitoring in Stash
In this section, we are going to enable Prometheus monitoring in Stash. We have to enable Prometheus monitoring during installing Stash. You have to use prometheus.io/operator as the agent for monitoring via Prometheus operator.
Here, we are going to enable monitoring for both backup metrics and operator metrics using Helm 3. We are going to tell Stash to create ServiceMonitor with release: prometheus-stack label so that the Prometheus server we have deployed in the previous section can collect Stash metrics without any further configuration.
New Installation
If you haven’t installed Stash yet, run the following command to enable Prometheus monitoring during installation
$ helm install stash appscode/stash -n kube-system \
--version v2021.06.23 \
--set features.community=true               \
--set stash-community.monitoring.agent=prometheus.io/operator \
--set stash-community.monitoring.backup=true \
--set stash-community.monitoring.operator=true \
--set stash-community.monitoring.serviceMonitor.labels.release=prometheus-stack \
--set-file global.license=/path/to/license-file.txt
Existing Installation
If you have installed Stash already in your cluster but didn’t enable monitoring during installation, you can use helm upgrade command to enable monitoring in the existing installation.
$ helm upgrade stash appscode/stash -n kube-system \
--reuse-values \
--set stash-community.monitoring.agent=prometheus.io/operator \
--set stash-community.monitoring.backup=true \
--set stash-community.monitoring.operator=true \
--set stash-community.monitoring.serviceMonitor.labels.release=prometheus-stack
Use
stash-enterpriseinstead ofstash-communityif you are using Stash Enterprise edition.
This will create a ServiceMonitor object with the same name and namespace as the Stash operator. The ServiceMonitor will have the label release: prometheus-stack as we have provided it through the --set monitoring.serviceMonitor.labels parameter.
Let’s verify that the ServiceMonitor has been created in the Stash operator namespace.
$ kubectl get servicemonitor -n kube-system
NAME    AGE
stash   65s
Let’s check the YAML of the ServiceMonitor object,
$ kubectl get servicemonitor stash -n kube-system -o yaml
apiVersion: monitoring.coreos.com/v1
kind: ServiceMonitor
metadata:
  annotations:
    meta.helm.sh/release-name: stash
    meta.helm.sh/release-namespace: kube-system
  labels:
    app.kubernetes.io/managed-by: Helm
    release: prometheus-stack
  name: stash
  namespace: kube-system
spec:
  endpoints:
  - honorLabels: true
    port: pushgateway
  - bearerTokenFile: /var/run/secrets/kubernetes.io/serviceaccount/token
    port: api
    scheme: https
    tlsConfig:
      ca:
        secret:
          key: tls.crt
          name: stash-apiserver-cert
      serverName: stash.kube-system.svc
  namespaceSelector:
    matchNames:
    - kube-system
  selector:
    matchLabels:
      app.kubernetes.io/instance: stash
      app.kubernetes.io/name: stash
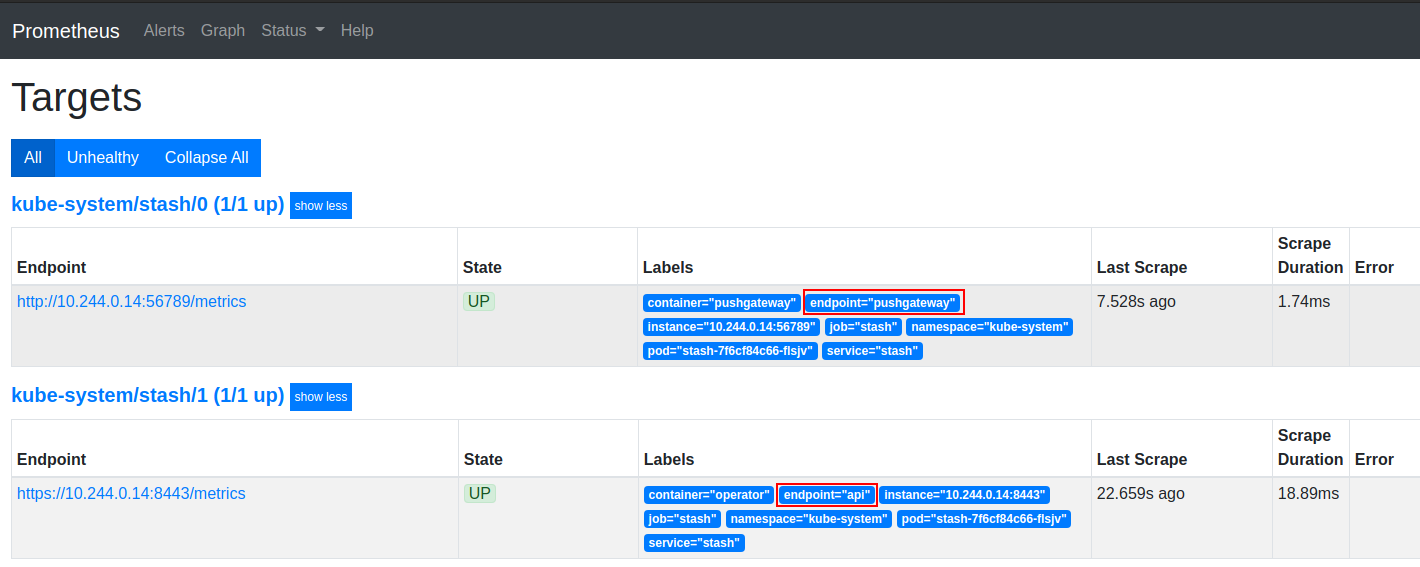
Here, we have two endpoints in spec.endpoints section. The pushgateway endpoint exports backup and recovery metrics and the api endpoint exports the operator metrics.
Verify Monitoring
As soon as the Stash operator pod goes into the Running state, the Prometheus server we have deployed in the first section should discover the endpoints exposed by Stash for metrics.
Now, we are going to forward port of prometheus-stack-kube-prom-prometheus Service to access the Prometheus web UI. Run the following command on a separate terminal,
$ kubectl port-forward -n monitoring service/prometheus-stack-kube-prom-prometheus 9090
Forwarding from 127.0.0.1:9090 -> 9090
Forwarding from [::1]:9090 -> 9090
Now, you can access the Web UI at localhost:9090. Open http://localhost:9090/targets in your browser. You should see pushgateway and api endpoints of the Stash operator are among the targets. This verifies that the Prometheus server is scrapping Stash metrics.
Cleanup
To cleanup the Kubernetes resources created by this tutorial, run:
# cleanup Prometheus resources
helm delete prometheus-stack -n monitoring

# delete namespace
kubectl delete ns monitoring
To uninstall Stash follow this guide.