


You are looking at the documentation of a prior release. To read the documentation of the latest release, please
visit here.
Stash Grafana Dashboard
Grafana provides an elegant graphical user interface to visualize data. You can create a beautiful dashboard easily with a meaningful representation of your Prometheus metrics.
We provide a pre-built Grafana dashboard to our Stash Enterprise users. In this guide, we are going to show you how you can import this dashboard from your Grafana UI.
Some basic metrics are also available for Stash Community Edition. You can create your dashboard using those metrics.
Before You Begin
- At first, you need to setup a Prometheus monitoring stack in your cluster. Please, follow the Prometheus Operator guide to setup your monitoring stack if you haven’t done already.
- Then, install Stash Enterprise edition with monitoring enabled. Please, follow this guide if you haven’t done already.
- You must have
stash_dashboard.jsonfile. Please, contact us to get the dashboard JSON file.
Install Panopticon
Stash Grafana dashboard depends on our another product called Panopticon. It is a Kubernetes state metric exporter similar to kube-state-metrics but generic for all Kubernetes resources including CRDs. In this section, we are going to show the installation procedure for Panopticon.
Issue License:
Like other AppsCode products, Panopticon also need a license to run. You can grab a 30 days trial license for Panopticon from here.
If you already have an enterprise license for KubeDB or Stash, you do not need to issue a new license for Panopticon. Your existing KubeDB or Stash license will work with Panopticon.
Install Panopticon:
Now, install Panopticon using the following commands:
$ helm repo add appscode https://charts.appscode.com/stable/
$ helm repo update

$ helm install panopticon appscode/panopticon -n kubeops \
    --create-namespace \
    --set monitoring.enabled=true \
    --set monitoring.agent=prometheus.io/operator \
    --set monitoring.serviceMonitor.labels.release=prometheus-stack \
    --set-file license=/path/to/license-file.txt
Make sure to use the appropriate label in monitoring.serviceMonitor.labels field according to your setup. This label is used by the Prometheus server to select the desired ServiceMonitor.
Import Stash Garafana Dashboard
At first, let’s port-forward the respective service for the Grafana dashboard so that we can access it through our browser locally.
❯ kubectl port-forward -n monitoring service/prometheus-stack-grafana 3000:80
Forwarding from 127.0.0.1:3000 -> 3000
Forwarding from [::1]:3000 -> 3000
Now, go to http://localhost:3000 in your browser and login to your Grafana UI. If you followed the Prometheus Operator guide to deploy your Prometheus stack, then the default username and password should be admin, and prom-operator respectively.
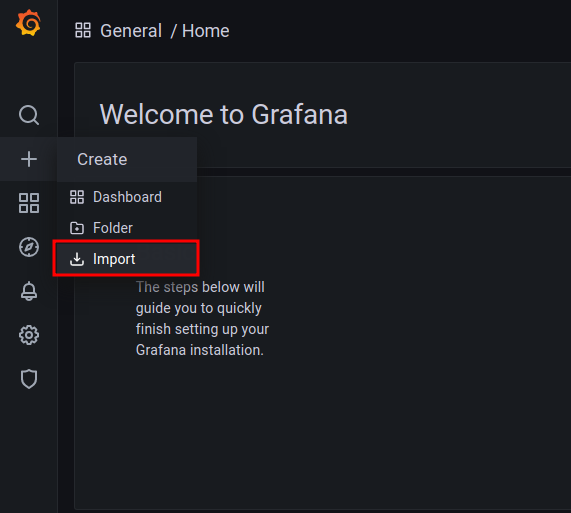
Then, on the Grafana UI, click the + icon from the left sidebar and then click on Import button as below,
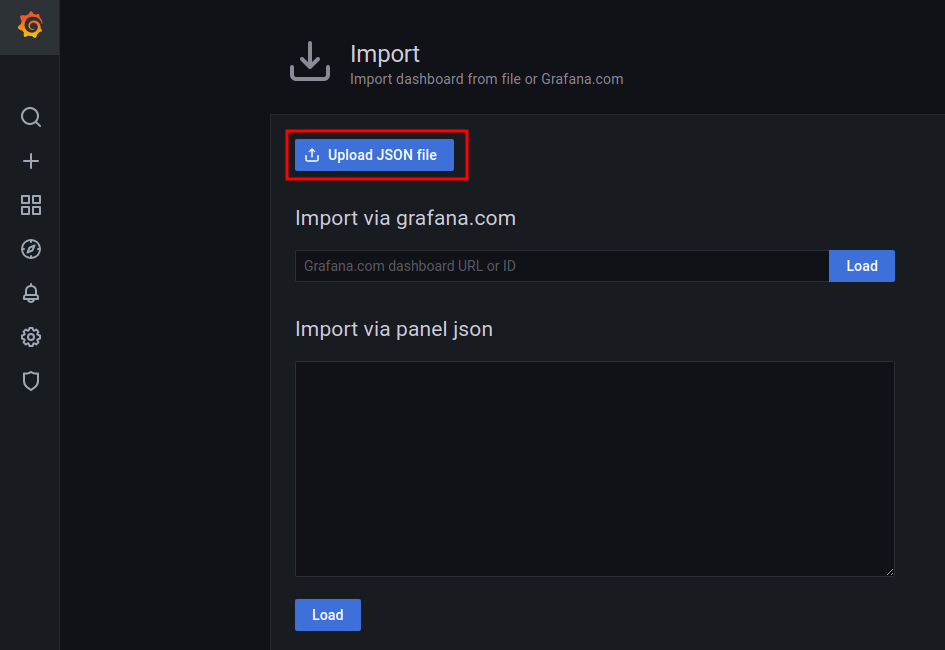
Then, on the import UI, you can either upload the stash_dashboard.json file by clicking the Upload JSON file button or you can paste the content of the JSON file in the text area labeled as Import via panel json.
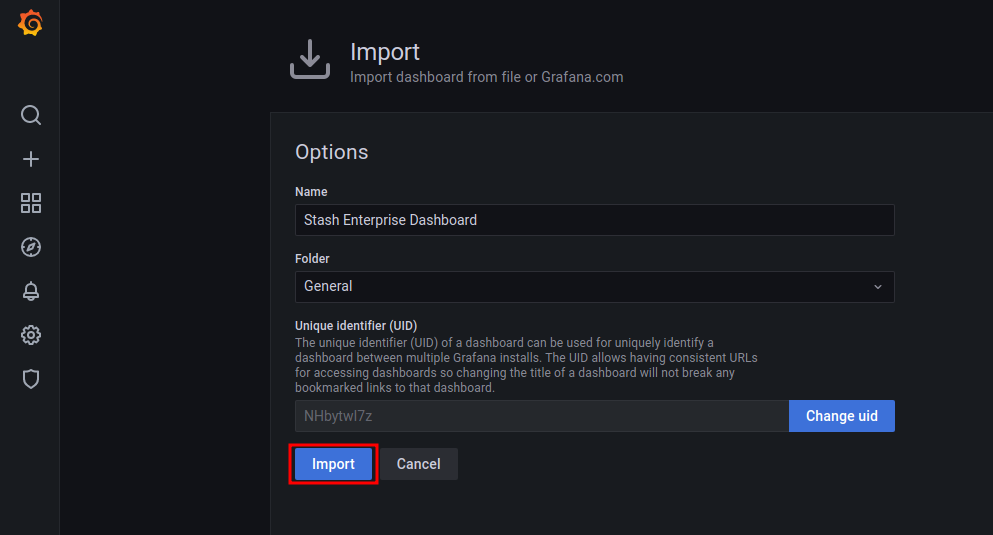
Then, on the next step click the Import button as below.
Once, you have successfully imported the dashboard, you should see the Stash dashboard similar to this.
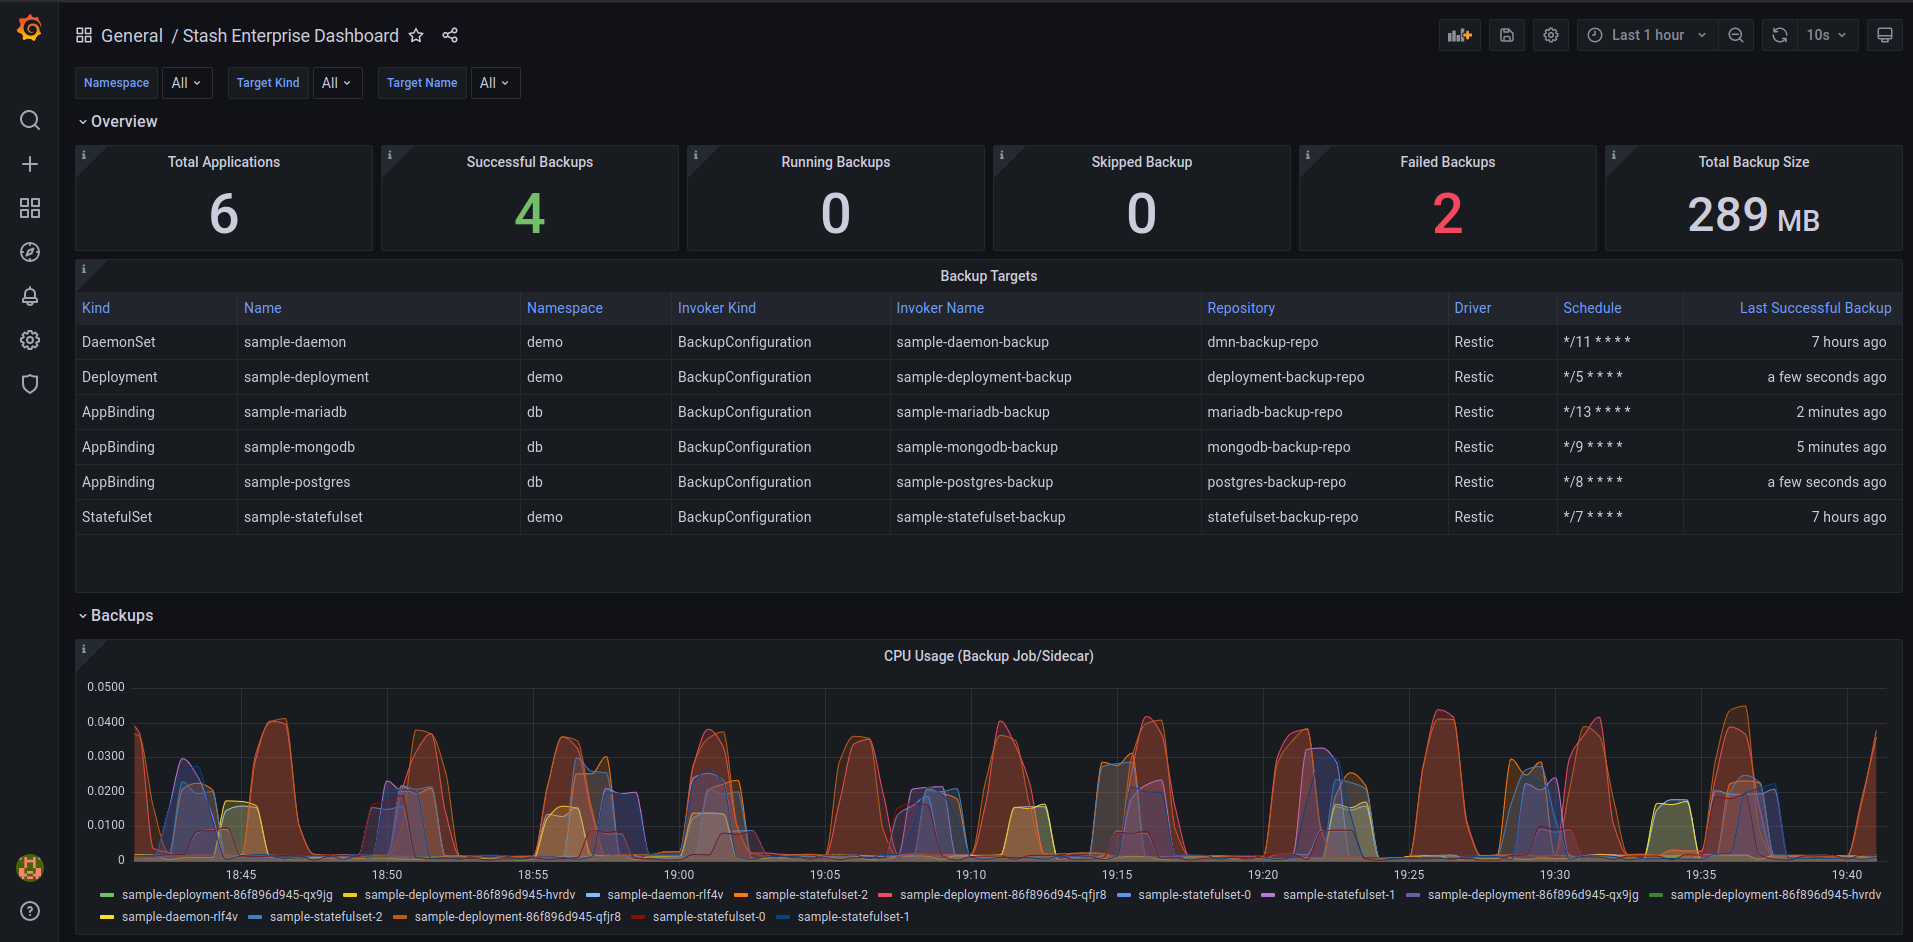
If your cluster does not have any backup configured, you may see the dashboard panels are empty. Nothing to worry about here. Just, run some backups and your dashboard should be populated automatically.
Dashboard Tour
The following video gives a tour of the different components of the Stash Grafana dashboard.