


You are looking at the documentation of a prior release. To read the documentation of the latest release, please
visit here.
Monitoring Stash with builtin Prometheus
This tutorial will show you how to configure builtin Prometheus scraper to monitor Stash backup and restore operations as well as the Stash operator.
To keep Prometheus resources isolated, we are going to use a separate namespace called monitoring to deploy the Prometheus server and its respective resources. Create the namespace as below if you haven’t done already.
$ kubectl create ns monitoring
namespace/monitoring created
Enable Monitoring in Stash
At first, we have to enable Prometheus monitoring in Stash during installation. We have to use prometheus.io/builtin as the agent for monitoring via built-in Prometheus.
Here, we are going to enable monitoring for both backup metrics and operator metrics using Helm 3.
New Installation
If you haven’t installed Stash yet, run the following command to enable Prometheus monitoring during installation
$ helm install stash appscode/stash -n kube-system \
--version v2021.06.23 \
--set features.community=true               \
--set stash-community.monitoring.agent=prometheus.io/builtin \
--set stash-community.monitoring.backup=true \
--set stash-community.monitoring.operator=true \
--set-file global.license=/path/to/license-file.txt
Existing Installation
If you have installed Stash already in your cluster but didn’t enable monitoring during installation, you can use helm upgrade command to enable monitoring in the existing installation.
$ helm upgrade stash appscode/stash -n kube-system \
--reuse-values \
--set stash-community.monitoring.agent=prometheus.io/builtin \
--set stash-community.monitoring.backup=true \
--set stash-community.monitoring.operator=true
Use
stash-enterpriseinstead ofstash-communityif you are using Stash Enterprise edition.
This will add the necessary annotations to stash Service. Prometheus server will discover the respective endpoints using those annotations.
Let’s verify the annotations has been added to the Service,
$ kubectl get service -n kube-system stash -o yaml
apiVersion: v1
kind: Service
metadata:
  annotations:
    meta.helm.sh/release-name: stash
    meta.helm.sh/release-namespace: kube-system
    prometheus.io/operator_path: /metrics
    prometheus.io/operator_port: "8443"
    prometheus.io/operator_scheme: https
    prometheus.io/pushgateway_path: /metrics
    prometheus.io/pushgateway_port: "56789"
    prometheus.io/pushgateway_scheme: http
    prometheus.io/scrape: "true"
  labels:
    app.kubernetes.io/instance: stash
    app.kubernetes.io/managed-by: Helm
    app.kubernetes.io/name: stash
    app.kubernetes.io/version: v0.11.7
    helm.sh/chart: stash-v0.11.7
  name: stash
  namespace: kube-system
spec:
  clusterIP: 10.110.53.2
  ports:
  - name: api
    port: 443
    protocol: TCP
    targetPort: 8443
  - name: pushgateway
    port: 56789
    protocol: TCP
    targetPort: 56789
  selector:
    app.kubernetes.io/instance: stash
    app.kubernetes.io/name: stash
  sessionAffinity: None
  type: ClusterIP
status:
  loadBalancer: {}
The stash Service has two endpoints. The pushgateway endpoint exports backup, restore, and repository metrics and the api endpoint exports Stash operator metrics.
If you look at the annotations section of the above Service, you should see that Stash has added Prometheus specific annotations (prefixed with prometheus.io) to the Service.
Here, prometheus.io/scrape: "true" annotation indicates that Prometheus should scrape metrics for this service.
The following three annotations point to pushgateway endpoint which provides backup and restore metrics.
prometheus.io/pushgateway_path: /metrics
prometheus.io/pushgateway_port: "56789"
prometheus.io/pushgateway_scheme: http
The following three annotations point to api endpoint which provides operator metrics.
prometheus.io/builtin_path: /metrics
prometheus.io/builtin_port: "8443"
prometheus.io/builtin_scheme: https
Now, we are ready to configure our Prometheus server to scrape those metrics.
Deploy Prometheus Server
In this section, we are going to configure & deploy a Prometheus server to scrape Stash metrics using the stash Service. We are going to deploy the Prometheus server in monitoring namespace.
Copy Certificate Secret:
We have deployed Stash in kube-system namespace. Stash exports operator metrics via TLS secured api endpoint. So, the Prometheus server needs to provide the respective certificate during scraping the metrics from this endpoint. Stash should create a secret named stash-apiserver-certs with the certificate in kube-system.
Let’s verify that the Secret has been created in kube-system namespace.
$ kubectl get secret -n kube-system -l app.kubernetes.io/instance=stash
NAME                   TYPE     DATA   AGE
stash-apiserver-cert   Opaque   2      6m
stash-license          Opaque   1      6m
Now, we have to copy this Secret in monitoring namespace so that we can mount the certificate into our Prometheus server.
Let’s copy the stash-apiserver-cert Secret into monitoring namespace using the following command,
kubectl get secret stash-apiserver-cert --namespace=kube-system -oyaml | grep -v '^\s*namespace:\s' | kubectl apply --namespace=monitoring -f -
Verify that the Secret has been copied successfully in the monitoring namespace,
$ kubectl get secret -n monitoring -l app.kubernetes.io/instance=stash
NAME                   TYPE     DATA   AGE
stash-apiserver-cert   Opaque   2      109s
Create RBAC:
Now, let’s create the necessary RBAC stuffs for the Prometheus server,
$ kubectl apply -f https://github.com/stashed/docs/raw/v2021.06.23/docs/guides/latest/monitoring/examples/prom-rbac.yaml
clusterrole.rbac.authorization.k8s.io/stash-prometheus-server created
serviceaccount/stash-prometheus-server created
clusterrolebinding.rbac.authorization.k8s.io/stash-prometheus-server created
Create ConfigMap:
Now, create a ConfigMap with the necessary scraping configuration. Bellow, the YAML of the ConfigMap that we are going to create for scrapping metrics from Stash.
apiVersion: v1
kind: ConfigMap
metadata:
  name: stash-prometheus-server-conf
  labels:
    name: stash-prometheus-server-conf
  namespace: monitoring
data:
  prometheus.yml: |-
    global:
      scrape_interval: 30s
      scrape_timeout: 10s
      evaluation_interval: 30s
    scrape_configs:
    - job_name: stash-pushgateway
      scrape_interval: 30s
      scrape_timeout: 10s
      metrics_path: /metrics
      scheme: http
      honor_labels: true
      kubernetes_sd_configs:
      - role: endpoints
      relabel_configs:
      - source_labels: [__meta_kubernetes_service_label_app_kubernetes_io_instance]
        regex: stash # default label for stash Service is "app.kubernetes.io/instance: stash". customize this field according to label of stash Service of your setup.
        action: keep
      - source_labels: [__meta_kubernetes_service_annotation_prometheus_io_scrape]
        regex: true
        action: keep
      - source_labels: [__meta_kubernetes_endpoint_port_name]
        regex: pushgateway
        action: keep
      - source_labels: [__meta_kubernetes_service_annotation_prometheus_io_pushgateway_path]
        regex: (.+)
        target_label: __metrics_path__
        action: replace
      - source_labels: [__meta_kubernetes_service_annotation_prometheus_io_pushgateway_scheme]
        action: replace
        target_label: __scheme__
        regex: (https?)
      - source_labels: [__address__, __meta_kubernetes_service_annotation_prometheus_io_pushgateway_port]
        action: replace
        target_label: __address__
        regex: ([^:]+)(?::\d+)?;(\d+)
        replacement: $1:$2
      - source_labels: [__meta_kubernetes_namespace]
        separator: ;
        regex: (.*)
        target_label: namespace
        replacement: $1
        action: replace
      - source_labels: [__meta_kubernetes_service_name]
        separator: ;
        regex: (.*)
        target_label: service
        replacement: $1
        action: replace
    - job_name: stash-operator
      scrape_interval: 30s
      scrape_timeout: 10s
      metrics_path: /metrics
      scheme: https
      kubernetes_sd_configs:
      - role: endpoints
      bearer_token_file: /var/run/secrets/kubernetes.io/serviceaccount/token
      tls_config:
        ca_file: /etc/prometheus/secret/stash-apiserver-cert/tls.crt
        server_name: stash.kube-system.svc
      relabel_configs:
      - source_labels: [__meta_kubernetes_service_label_app_kubernetes_io_instance]
        regex: stash # default label for stash Service is "app.kubernetes.io/instance: stash". customize this field according to label of stash Service of your setup.
        action: keep
      - source_labels: [__meta_kubernetes_service_annotation_prometheus_io_scrape]
        regex: true
        action: keep
      - source_labels: [__meta_kubernetes_endpoint_port_name]
        regex: api
        action: keep
      - source_labels: [__meta_kubernetes_service_annotation_prometheus_io_operator_path]
        regex: (.+)
        target_label: __metrics_path__
        action: replace
      - source_labels: [__meta_kubernetes_service_annotation_prometheus_io_operator_scheme]
        action: replace
        target_label: __scheme__
        regex: (https?)
      - source_labels: [__address__, __meta_kubernetes_service_annotation_prometheus_io_operator_port]
        action: replace
        target_label: __address__
        regex: ([^:]+)(?::\d+)?;(\d+)
        replacement: $1:$2
      - source_labels: [__meta_kubernetes_namespace]
        separator: ;
        regex: (.*)
        target_label: namespace
        replacement: $1
        action: replace
      - source_labels: [__meta_kubernetes_service_name]
        separator: ;
        regex: (.*)
        target_label: service
        replacement: $1
        action: replace
Here, we have two scraping jobs. The stash-pushgateway job scrapes the backup and restore metrics and the stash-operator job scrapes operator metrics.
Notice the tls_config field of stash-operator job. We have provided the certificate file through ca_file field. This certificate comes from stash-apiserver-cert that we are going to mount in the Prometheus Deployment. Here, server_name is used to verify hostname. In our case, the certificate is valid for hostname server and stash.kube-system.svc.
Also, note that we have provided a bearer-token file through bearer_token_file field. This file is a token for stash-prometheus-server ServiceAccount that we have created during creating the RBAC stuffs. This is required for authorizing Prometheus to Stash API Server.
Let’s create the ConfigMap we have shown above,
$ kubectl apply -f https://github.com/stashed/docs/raw/v2021.06.23/docs/guides/latest/monitoring/examples/prom-config.yaml
configmap/stash-prometheus-server-conf created
Deploy Prometheus:
Now, we are ready to deploy our Prometheus server. YAML for the Deployment that we are going to create is shown below.
apiVersion: apps/v1
kind: Deployment
metadata:
  name: stash-prometheus-server
  namespace: monitoring
spec:
  replicas: 1
  selector:
    matchLabels:
      app: prometheus
  template:
    metadata:
      labels:
        app: prometheus
    spec:
      serviceAccountName: stash-prometheus-server
      containers:
      - name: prometheus
        image: prom/prometheus:v2.23.0
        args:
        - "--config.file=/etc/prometheus/prometheus.yml"
        - "--storage.tsdb.path=/prometheus/"
        ports:
        - containerPort: 9090
        volumeMounts:
        - name: prometheus-config-volume
          mountPath: /etc/prometheus/
        - name: prometheus-storage-volume
          mountPath: /prometheus/
        - name: stash-apiserver-cert
          mountPath: /etc/prometheus/secret/stash-apiserver-cert
      volumes:
      - name: prometheus-config-volume
        configMap:
          defaultMode: 420
          name: stash-prometheus-server-conf
      - name: prometheus-storage-volume
        emptyDir: {}
      - name: stash-apiserver-cert
        secret:
          defaultMode: 420
          secretName: stash-apiserver-cert
          items: # avoid mounting private key
          - key: tls.crt
            path: tls.crt
Notice that, we have mounted stash-apiserver-cert secret as a volume at /etc/prometheus/secret/stash-apiserver-cert directory. We have also mounted the ConfigMap stash-prometheus-server-conf that we have created earlier with the necessary configuration to scrape metrics from Stash.
Let’s create the Deployment we have shown above,
$ kubectl apply -f https://github.com/stashed/docs/raw/v2021.06.23/docs/guides/latest/monitoring/examples/prom-deployment.yaml
deployment.apps/stash-prometheus-server created
Now, wait for the Prometheus server to go into Running state,
$ kubectl get pods -n monitoring
NAME                                       READY   STATUS    RESTARTS   AGE
stash-prometheus-server-77d6bc8b68-wtxlt   1/1     Running   0          66s
Once the Prometheus server Pod goes into the Running state, it should automatically discover the Stash endpoints using the configuration we have provided in the ConfigMap.
Verify Monitoring Metrics
Now, we are going to verify whether the Prometheus server has discovered the Stash endpoints or not. The Prometheus server we have deployed above is running on port 9090. We are going to use port forwarding to access the Prometheus web UI.
Run following command on a separate terminal to port-forward the Prometheus server Pod,
$ kubectl port-forward -n monitoring stash-prometheus-server-77d6bc8b68-wtxlt 9090
Forwarding from 127.0.0.1:9090 -> 9090
Forwarding from [::1]:9090 -> 9090
Now, we can access the web UI at localhost:9090. Open http://localhost:9090/targets in your browser. You should see pushgateway and api endpoints of stash service as targets.
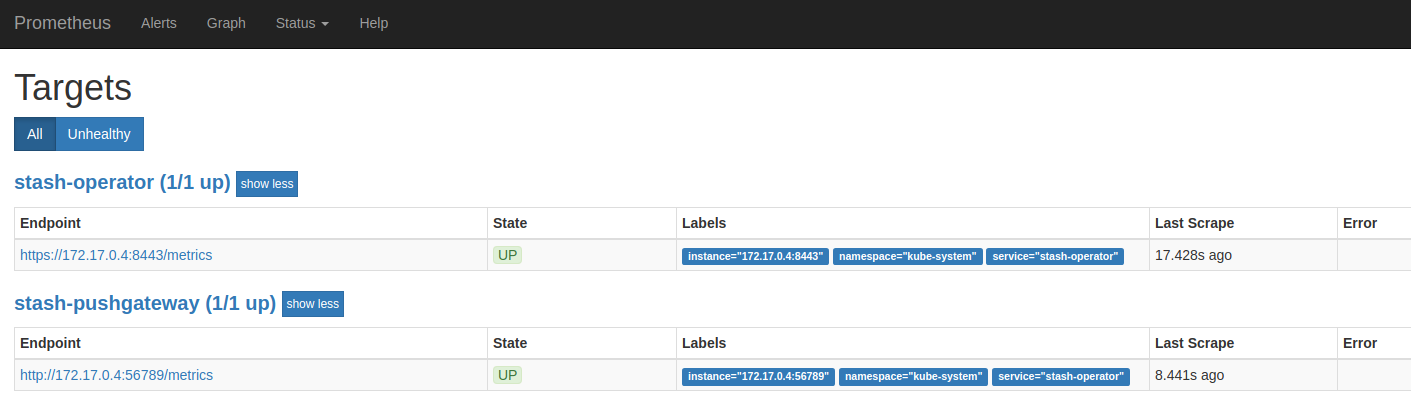
As you can see from the above image that the Prometheus server has successfully discovered the Stash endpoints. Now, if you perform backup and restore operations, you should see the respective metrics have been scrapped by the Prometheus server.
Cleanup
To cleanup the Kubernetes resources created by this tutorial, run:
kubectl delete clusterrole stash-prometheus-server
kubectl delete clusterrolebinding stash-prometheus-server

kubectl delete serviceaccount/stash-prometheus-server -n monitoring
kubectl delete configmap/stash-prometheus-server-conf -n monitoring
kubectl delete deployment stash-prometheus-server -n monitoring
kubectl delete secret stash-apiserver-cert -n monitoring

kubectl delete ns monitoring
To uninstall Stash follow this guide.